A market data centralization project is often structured so that the rates that are used to build the yield curve are included in the project’s early phases. This is because of the central importance of the yield curve to many aspects of a bank’s trading book. One of the methods for yield curve construction is bootstrapping. This week’s note describes the bootstrapping process in the context of curves in general and discusses some of the financial instruments used in the bootstrapping process.
In a bank’s trading book, future cash flows need to be discounted at the risk-free rate applicable on each CF date. A yield curve contains the required risk-free rates. The yield curve needs to be created from observable market quotes of interest rate instruments that are free of credit risk.
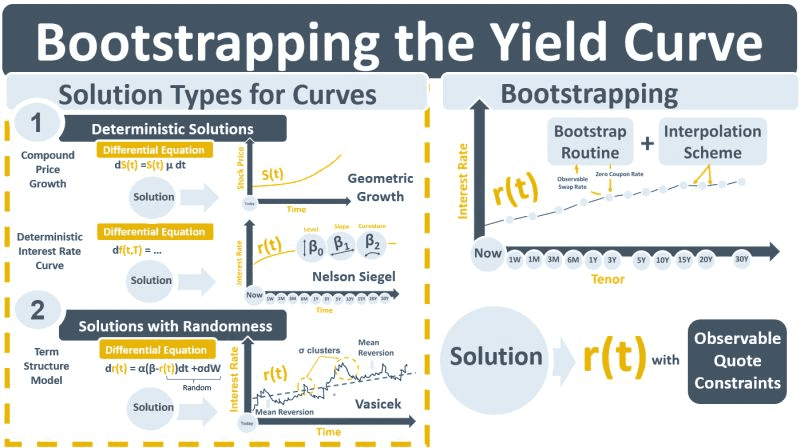
A curve is a generic function that plots rates or prices against time. A differential equation (DE) specifies how the prices move over time. Each DE will begin with a dS or a df or a dr. DEs by themselves cannot be used to plot curves. However, DEs have solutions that allow the curves to be plotted. For stock prices for example, dS(t) =S(t)μdt is the DE for compounded stock price changes with a growth rate of μ. The solution is S(t)=[some functional form]. Once you know the functional form of the curve you can determine the exact stock price S for a given time t.
An interest rate, r(t) for a period t consists of a series of very small forward rates f(t,T) added up over the period. A DE represented by df(t,T) exists that models how forward rates change over time. One of the solutions to the forward rate DE is the Nelson Siegel (NS) yield curve model. It is a functional form for r(t) that can be parameterized using parameters that determine the curve’s level, slope and curvature. The NS curve is typically fit to observable quotes by changing the NS parameters so that the distance between the curve and the observable market rates is minimized. The NS curve does need to reproduce exactly the prices of the observable rates that were used to generate it.
When there are options in a trading book, smooth curves generated by deterministic functional forms like NS no longer suffice. A statistically-generated range of prices above and below each curve is required to estimate the probabilities that options priced using the curve will expire in-the-money. Stochastic term structure models such as the Vasicek model generate curves with such probabilistic ranges.
A bootstrapped yield curve is not a stochastic term structure model like Vasicek. It also does not have a DE. And because it does not have a DE it does not have a specific functional form for r(t) in a way that an NS curve does. Instead, the bootstrapping process is tasked with generating a function r(t) subject to the constraint that the observable price of each financial instrument that is used to generate r(t), e.g., deposits, FRAs, and swaps – can be exactly reproduced. The bootstrapping routine usually starts with shorter maturity instruments creating a series of yields for r(t) backed out from the observable quotes by building up to the longer-dated instruments. An interpolation routine is required to generate the curve for r(t) that will allow risk-free yields to be derived for maturities in between those of the observable instruments. The curve should be as smooth as possible.