In market data projects, there is often a phase that requires importing and validating historical time series of market prices. The note this week provides background on the use of historical time series within the context of the FRTB P&L attribution test (PLAT).
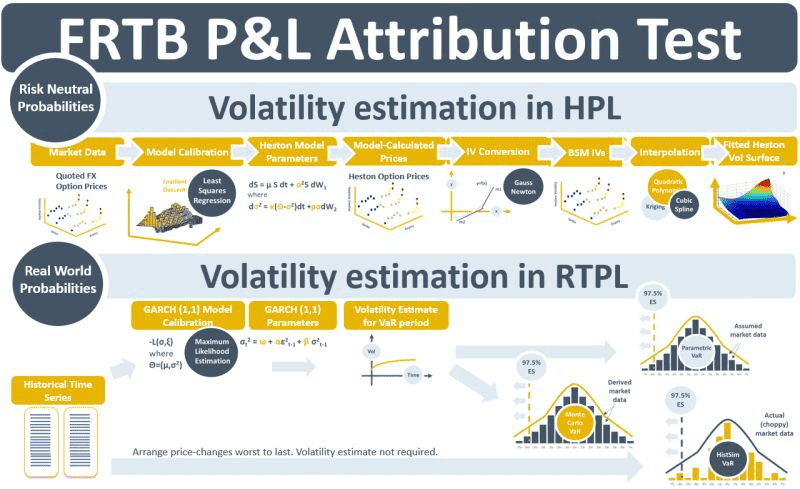
Volatility is the most important parameter in quantitative finance. It is used to estimate the probability that price changes will lead to cash flows for options and other derivatives. There are two ways that volatility can be estimated. The first is by extracting it from the market prices of traded options. This approach aligns with no-arbitrage valuation principles and the resulting implied volatilities (IVs) act as the risk-neutral probabilities of price changes. The official daily P&L of a bank typically uses IVs when calculating derivative valuations. The second method for estimating volatility is statistically, by reading historical time-series of prices. Market risk calculations like value-at-risk (VaR) use this second type of volatility estimate. In derivatives pricing theory probabilities of price changes, i.e., volatilities, backed out of empirical time-series data are referred to as real-world probabilities.
Regulators require that banks estimate worst-case losses of their portfolios using VaR. Distributions of risk factor price changes are simulated and used to create portfolio P&Ls for each day of the VaR period. VaR is then determined using the worst P&L days. The simulations are generated using historical time series. Under the HistSim VaR method they are generated by sorting the price changes from highest to lowest directly from the time series. The parametric and Monte Carlo methods, on the other hand, use statistically calculated estimates of volatility for the VaR period by using techniques such as GARCH (1,1) and EWMA volatility.
The FRTB PLAT tests whether the P&L distributions generated by the VaR simulations are statistically close to the distributions of P&L generated by saving and storing market data each day over the same period and re-running the no-arbitrage valuation processes. Historical P&Ls calculated using HistSim and GARCH for use in VaR are referred to as risk-theoretical P&L (RTPL). Historical P&Ls generated using saved down no-arbitrage IV surfaces are referred to as hypothetical P&L (HPL). Both RTPL and HPL are calculated using the latest position data available.
RTPL and HPL will always be different as the processes for generating them use two different methods for volatility estimation.