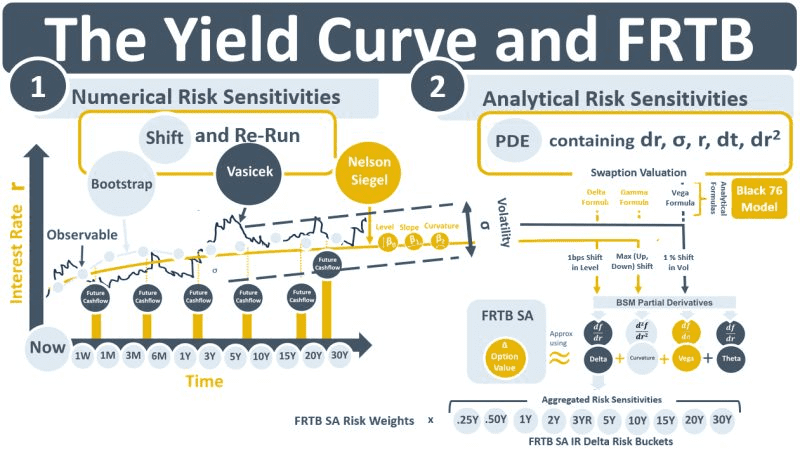
Historical time series data is central to market risk and FRTB use cases such as value-at-risk and expected shortfall. The yield curve is the most important risk factor in the trading book. This week’s note discusses the importance of the yield curve to market risk.
Market risk is the risk of losses due to adverse movements in market prices. FRTB requires that a bank set aside a capital amount commensurate with the size of its exposure to market risk. A risk factor is a traded financial instrument or a curve built from a group of instruments that the bank is exposed to. The price changes in multiple-instrument RFs are highly correlated. A yield curve is an example of a multiple-instrument RF. The instruments that are used to build it, e.g., deposits, futures, swaps are all exposed to changes in an underlying index (e.g., ESTR, SONIA, EFFR or LIBOR3M). Each instrument has exposure to a different maturity segment. The YC is the most important RF in a trading book. Valuations of OTCs in all risk classes require the multiplication of expected future cash flows by discount factors that are extracted from the YC.
An RF is shocked to generate a theoretical $-loss that is used as market risk capital. Under FRTB IMA, the shock is calculated using actual historical or simulated historical changes in RFs. Under FRTB SA, the shock sizes are specified in the FRTB document. They are then applied to the bank’s exposures to those RFs, which are called risk sensitivities (RS). Three sensitivity types – delta, curvature and vega – exist across seven risk classes. The delta RS in the interest rate risk class is an exposure to changes in the YC.
There are two approaches for calculating RSs. Under the numerical approach they are generated by shocking the YC level or its volatility, and then re-running trade valuations. The resulting changes in valuations are the RSs associated with the YC. The second approach is analytical. Changes in e.g., a swaptions price over time can be modelled using partial differential equations (PDEs) that take the YC and its volatility as input. Delta, curvature and vega are the partial derivatives of PDEs and they can be calculated using formulas. RSs can be generated either by Market Risk systems directly or by trading desk systems and re-used by Market Risk.
More generally, trading desks typically use different models and market data than Market Risk. E.g., the desk might use a bootstrapping approach to build the YC because it re-prices its constituent instruments exactly. Versus the use of Nelson Siegel parameters by Market Risk because of the flexibility it offers for curve-building for different risk scenarios. In the area of volatility estimation, the Vasicek model might be used by traders because it can reproduce observed implied volatilities. Whereas Market Risk teams often use GARCH models to generate volatility in HistSim approaches.
In all cases, the P&L shocks generated by Market Risk need to be good approximations of the official P&L generated by the desk. The P&L Attribution test under IMA is designed to ensure that Market Risk approximations of historical P&Ls are sufficiently close to trading desk actual historical P&Ls.

